Explore disability data with our custom tools
Data should be easy to explore, understand, and apply. Whether you're analyzing policy, preparing a report, or advocating for change, our tools put more than 16 years of disability data at your fingertips—organized, visualized, and built for usability. Every chart, table, and trend is designed with accessibility in mind—so you can focus on the insights that move your work forward.
Build Your Own Statistics: Create custom county- or state-level data visualizations tailored to your needs.
Compendium and Curated Reports: Access expertly compiled reports in our Annual Disability Statistics Collection (ADSC) that track trends and provide critical insights.

Monthly expert analysis of national Trends in Disability Employment (nTIDE)
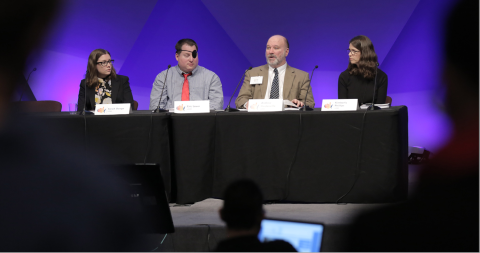
On the first Friday of every month, our national Trends in Disability Employment (nTIDE) team shares the latest employment data during a live webinar, aligned with the U.S. jobs report. Join researchers, field experts, and guest panelists for fresh insights, data interpretation, and real-world context you can use.

View into Disability in America
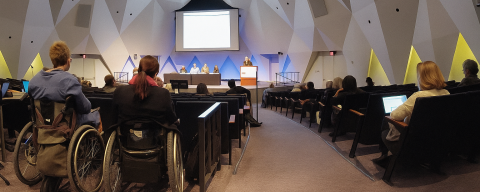
Catch up on on past Annual Disability Statistics Conferences insights, recordings, and materials. Each event provides a snapshot into disability in America—bringing together the latest data on population, employment, education, and public programs.
Save the Date: 2026 Annual Disability Statistics Conference
Where disability data drives change
Data is most powerful when shared. The ADSC connects researchers, policymakers, advocates, and community members who are committed to using evidence to inform decisions and strengthen opportunities for all. This year, the Center for Research on Disability is expanding access to data with the new Build Your Own Statistics tool—making it easier than ever to visualize and compare disability data by state, county, or population group. In addition to the release of the Annual Disability Statistics Collection, the 2026 conference will also feature new analyses from our ongoing collaboration with the American Foundation for the Blind, including data on the experiences of older adults with vision loss.

